Some links to products and partners on this website will earn an affiliate commission.
I published a piece yesterday looking at the busiest airports in the UK. The data for that came from the Civil Aviation Authority website, which has lots of other fascinating (if you’re a bit of an aviation nerd!) insights too. One that caught my eye was the most recent published set of flight punctuality stats – for Q3 2017.
“Punctuality of arriving and departing passenger flights is measured by comparing actual and planned
times of operation. On-time performance is defined as the proportion of flights arriving or departing early or up to and including 15 minutes late. It is calculated from the scheduled on-stand time, the reported runway time and the expected time an aircraft takes to travel between a stand and the runway”
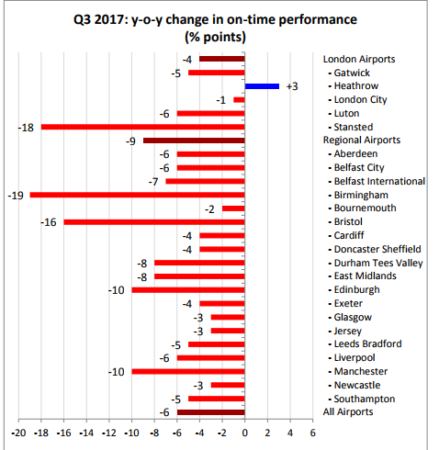
As you can see from the chart below, with the exception of Heathrow, the year on year comparison with Q3 2016 isn’t very impressive for most airports:

Stansted, Birmingham and Bristol, in particular, seem to have taken a real battering when it comes to on-time performance! I’d love to hear if any knowledgeable readers have some ideas on why the increase in the number of delays seems so dramatic for those airports.
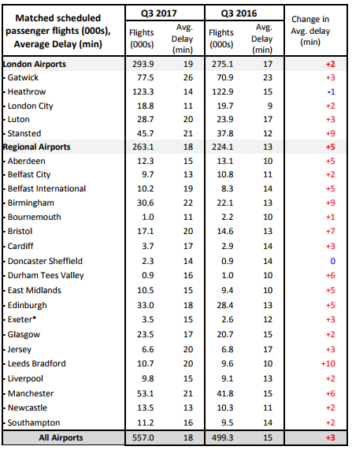
Not only was the number of delays worse than in 2016, the length of the delays increased almost everywhere too (with Heathrow again being the only airport to show improvement):

You can find all the scheduled flight punctuality stats at the end of a broader report on aviation trends here.
Conclusion
The CAA website has a treasure trove of aviation statistics, going back years. Let me know if you spot anything else interesting over there!


Leave a Reply